
Page 289 - ANALYSIS.XLS
P. 289
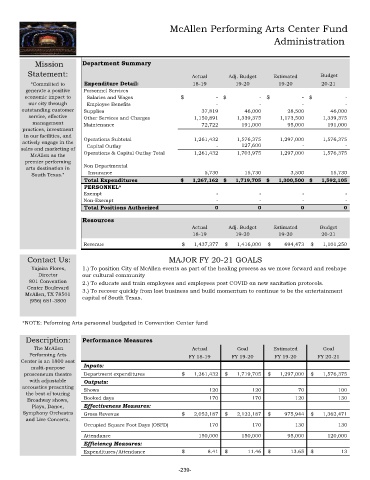
McAllen Performing Arts Center Fund
                                                                                            Administration


             Mission        Department Summary
          Statement:                                             Actual      Adj. Budget    Estimated       Budget

           “Committed to     Expenditure Detail:                 18-19         19-20         19-20         20-21
          generate a positive   Personnel Services
         economic impact to    Salaries and Wages            $          -    $         -    $        -    $        -
          our city through     Employee Benefits                        -              -             -             -
        outstanding customer   Supplies                              37,819        46,000         28,500        46,000
          service, effective   Other Services and Charges          1,150,891     1,339,375     1,173,500     1,339,375
            management       Maintenance                             72,722       191,000         95,000       191,000
        practices, investment
         in our facilities, and
        actively engage in the   Operations Subtotal               1,261,432     1,576,375     1,297,000 -      1,576,375 -
                                                                                 127,600
        sales and marketing of     Capital Outlay                        -
           McAllen as the    Operations & Capital Outlay Total     1,261,432     1,703,975     1,297,000     1,576,375
         premier performing
          arts destination in   Non Departmental
           South Texas."       Insurance                              5,730        15,730          3,500        15,730
                             Total Expenditures              $      1,267,162  $      1,719,705  $      1,300,500  $      1,592,105
                             PERSONNEL*
                             Exempt                                      -             -             -             -
                             Non-Exempt                                  -             -             -             -
                             Total Positions Authorized                 0             0              0             0

                            Resources
                                                                 Actual      Adj. Budget    Estimated      Budget
                                                                 18-19         19-20         19-20         20-21
                             Revenue                         $      1,437,377  $      1,416,000  $      694,473  $      1,101,250
                                                                         -                         -  -                         -
          Contact Us:                                    MAJOR FY 20-21 GOALS
            Yajaira Flores,    1.) To position City of McAllen events as part of the healing process as we move forward and reshape
              Director      our cultural community
           801 Convention   2.) To educate and train employees and employees post COVID on new sanitation protocols.
          Center Boulevard  3.) To recover quickly from lost business and build momentum to continue to be the entertainment
         McAllen, TX 78501  capital of South Texas.
           (956) 681-3800


        *NOTE: Peforming Arts personnel budgeted in Convention Center fund

          Description:      Performance Measures
             The McAllen                                         Actual        Goal         Estimated       Goal
           Performing Arts                                     FY 18-19       FY 19-20      FY 19-20      FY 20-21
        Center is an 1800 seat
           multi-purpose     Inputs:
         prosceneum theatre   Department expenditures        $      1,261,432  $      1,719,705  $      1,297,000  $      1,576,375
           with adjustable   Outputs:
        accoustics presenting   Shows                                   120           120            70           100
          the best of touring
          Broadway shows,    Booked days                                170           170           120           130
            Plays, Dance,    Effectiveness Measures:
         Symphony Orchestra   Gross Revenue                  $      2,052,187  $      2,122,187  $      975,944  $      1,362,471
          and Live Concerts.
                             Occupied Square Foot Days (OSFD)           170         170              130           130

                             Attendance                              150,000     150,000          95,000       120,000

                             Efficiency Measures:
                             Expenditures/Attendance         $         8.41   $     11.46   $      13.65   $       13

                                                            -239-