
Page 14 - Budget FY 2022-2023 - Update
P. 14
City of McAllen, Texas Adopted Budget 2023
Local economic trends, Rebound from COVID Pandemic
The City’s economy has maintained an excellent financial position and has seen a rebound from the COVID Pandemic.
The calendar year 2022 has been marked with an increase in interest rates, labor shortages, rising energy prices,
and supply chain issues affecting manufacturing and industry� The City’s economy has historically been linked to
that of Northern Mexico and its shoppers, but this has been shifting over the past decade to one with higher average
wages centered around the rapid expansion of both the medical service and education sectors� The City’s many
construction projects were noted by a rating agency as a major reason for continued economic stability� These
projects will continue for some years into the future� Additionally, there has been high levels of pent-up demand,
sales not consummated during COVID Pandemic, for single-family residences nationwide, statewide and in McAllen�
This created seldom seen increases in median home sales prices in McAllen and drastically reduced the inventory of
available homes which has led to higher prices locally� Local industry has adapted to rising costs and supply chain
issues by creatively using different inputs, finding efficiencies, and evolving to meet consumer demands.
Metro area Employment Trends, McAllen differential
According to the Texas Workforce Commission, over the last 10 years the McAllen-Edinburg-Mission Metro
Employment has grown from 292,840 in 2012 to 342,815 in 2022—a 17% increase� The City of McAllen’s Employment
has grown from 57,459 in 2012 to 65,841 in 2022—a 14% increase� The Metro’s Unemployment Rate is now 8% vs
a City of McAllen Rate of 5�4%�
McAllen’s important retail sector
Fiscal Year 2020-2021 saw strong demand in the Retail Sector� Retail businesses showed resiliency during the
Pandemic and bounced back having demonstrated sustainability with local Rio Grande Valley shoppers during the
Federal Government’s travel restrictions of international shoppers at air and land ports of entry with restrictions
lifted November 8, 2021�
Fiscal Year 2021-2022, saw increases in inflation and rising gas prices leading households to increase demand of
budget friendly offerings; households made less trips to the store but left the store with bigger baskets, with visit
durations increasing, leading to higher overall sales� During this time, at the other end of the spectrum, luxury goods
saw an increase in pent up demand from shoppers looking to socialize, seek out entertainment, and enjoy other forms
of conspicuous consumption� Discretionary spending, or the power in spending for non-essential items, is coming
back with the summer of 2022 being the first year since the pandemic when more and more households made the
conscious choice to spend on family vacations or other forms of recreation� Domestic travel, summer vacations, and
international travel has seen a return to normal� For the retail sector, the trend is a return to brick and mortar with
consumers wanting to participate in immersive experiences, a trend known as “experiential” retail or “retailtainment�”
The idea is that if you capture the consumers time and attention, then you will also capture wallet share�
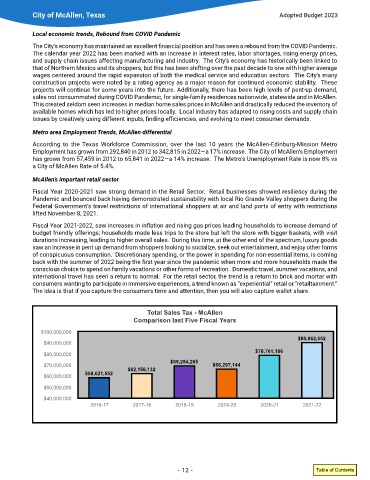
Total Sales Tax - McAllen
Comparison last Five Fiscal Years
$100,000,000
$89,962,552
$90,000,000
$78,761,186
$80,000,000
$69,284,265
$70,000,000 $66,297,144
$58,621,552 $62,156,132
$60,000,000
$50,000,000
$40,000,000
2016-17 2017-18 2018-19 2019-20 2020-21 2021-22
- 12 - Table of Contents