
Page 300 - Budget FY 2022-2023 - Update
P. 300
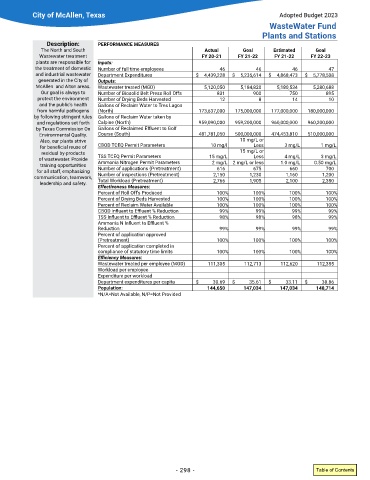
City of McAllen, Texas                                                           Adopted Budget 2023
                                                                                          WasteWater Fund
                                                                                        Plants and Stations
                 Description:    PERFORMANCE MEASURES
               The North and South                                   Actual      Goal      Estimated     Goal
              Wastewater treatment                                  FY 20-21    FY 21-22    FY 21-22    FY 22-23
             plants are responsible for   Inputs:
             the treatment of domestic   Number of full time employees    46          46          46          47
             and industrial wastewater   Department Expenditures  $  4,439,228  $  5,235,614  $  4,868,473  $  5,778,508
              generated in the City of   Outputs:
             McAllen  and Alton areas�   Wastewater treated (MGD)    5,120,050   5,184,820   5,180,534   5,280,688
               Our goal is always to   Number of Biosolid Belt Press Roll Offs  831  900         750         895
             protect the environment   Number of Drying Beds Harvested    12           8          14          10
              and the public’s health   Gallons of Reclaim Water to Tres Lagos
             from harmful pathogens   (North)                       173,637,000    175,000,000    177,000,000    180,000,000
            by following stringent rules  Gallons of Reclaim Water taken by
             and regulations set forth   Calpine (North)            959,090,000    959,200,000    960,000,000    960,200,000
             by Texas Commission On   Gallons of Reclaimed Effluent to Golf
              Environmental Quality�   Course (South)               481,781,050    500,000,000    474,453,810    510,000,000
              Also, our plants strive                                           10 mg/L or
              for beneficial reuse of   CBOD TCEQ Permit Parameters    10 mg/l       Less      3 mg/L      1 mg/L
               residual by-products                                             15 mg/L or
              of wastewater� Provide   TSS TCEQ Permit Parameters     15 mg/L        Less      4 mg/L      3 mg/L
                                 Ammonia Nitrogen Permit Parameters
              training opportunities                                   2 mg/L  2 mg/L or less  1�0 mg/L  0�50 mg/L
             for all staff, emphasizing   Number of applications (Pretreatment)  616  675        660         700
            communication, teamwork,   Number of inspections (Pretreatment)  2,150  1,230       1,160       1,200
                                 Total Workload (Pretreatment)
              leadership and safety�                                    2,766       1,905       2,100       2,350
                                 Effectiveness Measures:
                                 Percent of Roll Off’s Produced          100%        100%        100%        100%
                                 Percent of Drying Beds Harvested        100%        100%        100%        100%
                                 Percent of Reclaim Water Available      100%        100%        100%        100%
                                 CBOD Influent to Effluent % Reduction    99%         99%         99%         99%
                                 TSS Influent to Effluent % Reduction     98%         98%         98%         99%
                                 Ammonia N Influent to Effluent %
                                 Reduction                                99%         99%         99%         99%
                                 Percent of application approved
                                 (Pretreatment)                          100%        100%        100%        100%
                                 Percent of application completed in
                                 compliance of statutory time limits     100%        100%        100%        100%
                                 Efficiency Measures:
                                 Wastewater treated per employee (MGD)  111,305   112,713     112,620     112,355
                                 Workload per employee
                                 Expenditure per workload
                                 Department expenditures per capita  $  30�69  $   35�61  $    33�11  $     38�86
                                 Population:                          144,650     147,034     147,034     148,714
                                 *N/A=Not Available, N/P=Not Provided


                                                           - 298 -                                        Table of Contents