
Page 22 - APPROVED ANNUAL BUDGET BOOK FY 21-22
P. 22
City of McAllen, Texas Adopted Budget 2022
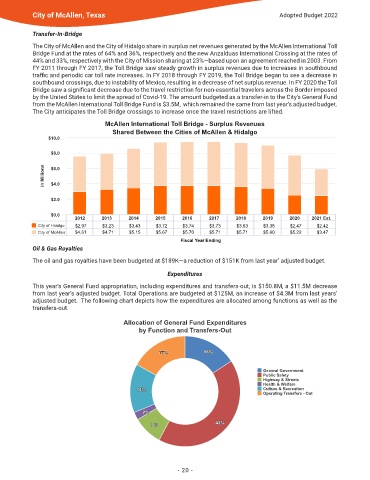
Transfer-In-Bridge
The City of McAllen and the City of Hidalgo share in surplus net revenues generated by the McAllen International Toll
Bridge Fund at the rates of 64% and 36%, respectively and the new Anzalduas International Crossing at the rates of
44% and 33%, respectively with the City of Mission sharing at 23%—based upon an agreement reached in 2003� From
FY 2011 through FY 2017, the Toll Bridge saw steady growth in surplus revenues due to increases in southbound
traffic and periodic car toll rate increases. In FY 2018 through FY 2019, the Toll Bridge began to see a decrease in
southbound crossings, due to instability of Mexico, resulting in a decrease of net surplus revenue� In FY 2020 the Toll
Bridge saw a significant decrease due to the travel restriction for non-essential travelers across the Border imposed
by the United States to limit the spread of Covid-19� The amount budgeted as a transfer-in to the City’s General Fund
from the McAllen International Toll Bridge Fund is $3�5M, which remained the same from last year’s adjusted budget�
The City anticipates the Toll Bridge crossings to increase once the travel restrictions are lifted�
McAllen International Toll Bridge - Surplus Revenues
Shared Between the Cities of McAllen & Hidalgo
$10.0
$8.0
in Millions $6.0
$4.0
$2.0
$0.0
2012 2013 2014 2015 2016 2017 2018 2019 2020 2021 Est.
$3.38
$3.72
$3.23
$3.73
$3.43
$2.47
$3.38
$3.74
$3.43
$3.74
$3.23
$2.42
$3.63
$3.63
$3.72
City of Hidalgo $2.97 $3.23 $3.43 $3.72 $3.74 $3.73 $3.63 $3.38 $2.47 $2.42
$2.47
$3.73
$2.42
$2.97
$2.97
$5.67
$5.67
$5.71
$5.60
$5.71
$5.70
$5.70
$5.71
$5.71
$5.22
$5.15
$5.15
$5.60
$4.71
$4.61
$4.61
$4.71
$5.22
$3.47
$3.47
City of McAllen $4.61 $4.71 $5.15 $5.67 $5.70 $5.71 $5.71 $5.60 $5.22 $3.47
Fiscal Year Ending
Oil & Gas Royalties
The oil and gas royalties have been budgeted at $189K—a reduction of $151K from last year’ adjusted budget�
Expenditures
This year’s General Fund appropriation, including expenditures and transfers-out, is $150�8M, a $11�5M decrease
from last year’s adjusted budget� Total Operations are budgeted at $125M, an increase of $4�3M from last years’
adjusted budget� The following chart depicts how the expenditures are allocated among functions as well as the
transfers-out�
Allocation of General Fund Expenditures
by Function and Transfers-Out
16%
16%
17% 16%
17%
17%
General Government
Public Safety
Highway & Streets
Health & Welfare
14%
14% Culture & Recreation
14%
Operating Transfers - Out
2%
2%
2%
42%
42%
9% 42%
9%
9%
- 20 -