
Page 156 - Budget FY 2022-2023 - Update
P. 156
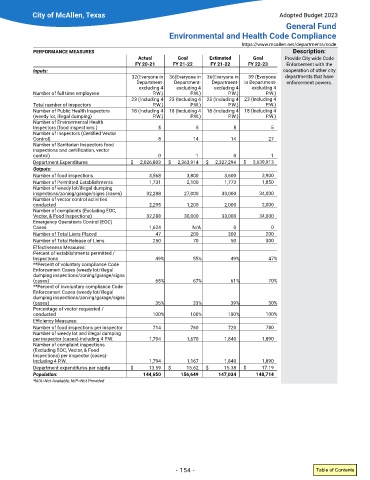
City of McAllen, Texas                                                           Adopted Budget 2023
                                                                                                General Fund
                                                         Environmental and Health Code Compliance
                                                                                 https://www�mcallen�net/departments/code
            PERFORMANCE MEASURES                                                                  Description:
                                               Actual       Goal      Estimated      Goal      Provide City wide Code
                                              FY 20-21    FY 21-22     FY 21-22    FY 22-23     Enforcement with the
            Inputs:                                                                            cooperation of other city
                                             32(Everyone in  36(Everyone in  36(Everyone in   39 (Everyone   departments that have
                                              Department-  Department-  Department-  in Department-  enforcement powers�
                                               excluding 4   excluding 4   excluding 4   excluding 4
            Number of full time employees           P�W�)       P�W�)       P�W�)        P�W�)
                                             23 (Including 4  23 (Including 4  23 (Including 4  23 (Including 4
            Total number of inspectors              P�W�)       P�W�)       P�W�)        P�W�)
            Number of Public Health Inspectors   18 (Including 4  18 (Including 4  18 (Including 4  18 (Including 4
            (weedy lot, illegal dumping)            P�W�)       P�W�)       P�W�)        P�W�)
            Number of Environmental Health
            Inspectors (food inspections )           5            5           5            5
            Number of Inspectors (Certified Vector
            Control)                                 8           14          14           27
            Number of Sanitarian Inspectors food
            inspections and certification, vector
            control)                                 0            1           0            1
            Department Expenditures            $  2,026,803     $  2,363,914     $  2,327,294    $  2,639,913
            Outputs:
            Number of food inspections            3,568        3,800       3,600        3,900
            Number of Permitted Establishments    1,731        2,100       1,773        1,850
            Number of weedy lot/illegal dumping
            inspections/zoning/garage/signs (cases)  32,288   27,000      33,000       34,000
            Number of vector control activities
            conducted                             2,295        1,200       2,000        2,000
            Number of complaints (Excluding EOC,
            Vector, & Food Inspections)          32,288       30,000      33,000       34,000
            Emergency Operations Control (EOC)
            Cases                                 1,624          N/A          0            0
            Number of Total Liens Placed            47          200         300          200
            Number of Total Release of Liens        250          70          50          300
            Effectiveness Measures:
            Percent of establishments permitted /
            Inspections                             49%          55%         49%          47%
            **Percent of voluntary compliance Code
            Enforcement Cases (weedy lot/illegal
            dumping inspections/zoning/garage/signs
            (cases)                                 65%          67%         61%          70%
            **Percent of involuntary compliance Code
            Enforcement Cases (weedy lot/illegal
            dumping inspections/zoning/garage/signs
            (cases)                                 35%          33%         39%          30%
            Percentage of vector requested /
            conducted                               100%        100%        100%         100%
            Efficiency Measures:
            Number of food inspections per inspector  714       760         720          780
            Number of weedy lot and illegal dumping
            per inspector (cases)-including 4 P�W�  1,794      1,670       1,840        1,890
            Number of complaint inspections
            (Excluding EOC, Vector, & Food
            Inspections) per inspector (cases)-
            Including 4 P�W�                      1,794        1,167       1,840        1,890
            Department expenditures per capita      $  13�59     $  15�62     $  15�38    $  17�19
            Population:                         144,650      156,649     147,034      148,714
            *N/A=Not Available, N/P=Not Provided


                                                           - 154 -                                        Table of Contents