
Page 428 - Budget FY 2022-2023 - Update
P. 428
City of McAllen, Texas Adopted Budget 2023
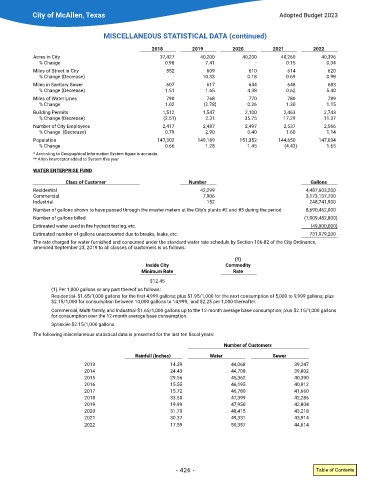
MISCELLANEOUS STATISTICAL DATA (continued)
2018 2019 2020 2021 2022
Acres in City 37,427 40,200 40,200 40,260 40,396
% Change 0�98 7�41 - 0�15 0�34
Miles of Street in City 552 609 610 614 620
% Change (Decrease) - 10�33 0�18 0�69 0�98
Miles in Sanitary Sewer 607 617 644 648 683
% Change (Decrease) 1�51 1�65 4�38 0�62 5�40
Miles of Water Lines 790 768 770 780 789
% Change 1�02 (2�78) 0�26 1�30 1�15
Building Permits 1,512 1,547 2,100 2,463 2,743
% Change (Decrease) (2�51) 2�31 35�75 17�29 11�37
Number of City Employees 2,417 2,487 2,497 2,537 2,566
% Change (Decrease) 0�79 2�90 0�40 1�60 1�14
Population 147,302 149,189 151,352 144,650 147,034
% Change 0�66 1�28 1�45 (4�43) 1�65
* According to Geographical Information System figure is accurate.
** Alton Interceptor added to System this year
WATER ENTERPRISE FUND
Class of Customer Number Gallons
Residential 42,299 4,487,603,200
Commercial 7,906 3,173,137,700
Industrial 152 248,741,900
Number of gallons shown to have passed through the master meters at the City’s plants #2 and #3 during the period 8,690,462,000
Number of gallons billed (7,909,482,800)
Estimated water used in fire hydrant testing, etc. (49,000,000)
Estimated number of gallons unaccounted due to breaks, leaks, etc� 731,979,200
The rate charged for water furnished and consumed under the standard water rate schedule by Section 106-82 of the City Ordinance,
amended September 23, 2019 to all classes of customers is as follows:
(1)
Inside City Commodity
Minimum Rate Rate
$12�45
(1) Per 1,000 gallons or any part thereof as follows:
Residential- $1.65/1,000 gallons for the first 4,999 gallons; plus $1.95/1,000 for the next consumption of 5,000 to 9,999 gallons; plus
$2�15/1,000 for consumption between 10,000 gallons to 14,999, and $2�25 per 1,000 thereafter�
Commercial, Multi-family, and Industrial-$1�65/1,000 gallons up to the 12-month average base consumption; plus $2�15/1,000 gallons
for consumption over the 12-month average base consumption�
Sprinkler-$2�15/1,000 gallons�
The following miscellaneous statistical data is presented for the last ten fiscal years:
Number of Customers
Rainfall (Inches) Water Sewer
2013 14�39 44,068 39,247
2014 24�43 44,708 39,802
2015 29�56 45,362 40,390
2016 15�55 46,195 40,912
2017 15�72 46,780 41,660
2018 33�50 47,399 42,286
2019 19�99 47,950 42,804
2020 31�70 48,415 43,218
2021 30�37 49,331 43,914
2022 17�59 50,357 44,614
- 426 - Table of Contents