
Page 82 - Budget FY 2022-2023 - Update
P. 82
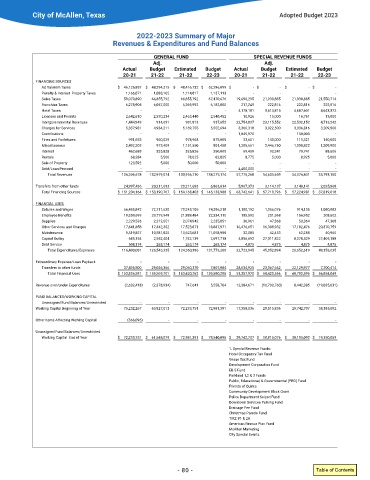
City of McAllen, Texas                                                           Adopted Budget 2023


                                              2022-2023 Summary of Major
                                      Revenues & Expenditures and Fund Balances

                                                    GENERAL FUND                     SPECIAL REVENUE FUNDS
                                                    Adj.                                 Adj.
                                          Actual    Budget    Estimated   Budget    Actual    Budget    Estimated   Budget
                                          20-21    21-22    21-22    22-23     20-21    21-22     21-22   22-23
             FINANCING SOURCES
               Ad Valorem Taxes         $  46,126,857    $  48,294,215    $  48,416,732   $  52,296,099   $  -  $  -   $  -  $  -
               Penalty & Interest  Property Taxes  1,166,071  1,083,165  1,114,817   1,137,113   -  -  -        -
               Sales Taxes                59,070,890  66,855,792  66,855,792   67,470,676   19,690,295   21,930,885  21,930,885   21,550,714
               Franchise Taxes             6,278,905  6,057,000  6,369,992   6,182,000   217,249   222,816  222,816   222,816
               Hotel Taxes                      -        -        -         -   4,178,181   3,614,815  4,687,601   4,643,372
               Licenses and Permits        2,642,610  2,570,234  2,463,440   2,540,452   10,926   15,000  16,761   15,000
               Intergovernmental Revenues  1,444,949  914,691  981,813   937,652   22,754,837   23,115,552  22,532,152   4,713,242
               Charges for Services        5,337,981  4,934,211  5,169,755   5,552,694   3,360,318   3,022,500  3,336,816   3,209,500
               Contributions                    -        -        -         -   1,845,970     -    150,000      -
               Fines and Forfeitures        991,653  960,029  978,968   875,005   33,601   140,000  111,321  140,000
               Miscellaneous               2,492,203  973,409  1,151,550   801,458   1,205,661   2,446,750  1,008,822  1,209,900
               Interest                     462,683  325,828  325,826   350,000   69,459   92,341   70,741   83,606
               Rentals                      68,284    5,500    78,025   82,025    8,775    5,000     8,925   5,000
               Sale of Property             123,592   5,000    50,000   50,000       -        -        -        -
               Debt/Loan Proceed                -        -        -         -   4,400,000     -        -        -
                 Total Revenues           126,206,678    132,979,074  133,956,710   138,275,174   57,775,268   54,605,659  54,076,841   35,793,150
             Transfers from other funds   24,997,486  20,211,693  20,211,693   6,863,814   5,967,373   3,114,137  3,148,141   2,025,868
               Total Financing Sources  $  151,204,164    $  153,190,767    $  154,168,403   $  145,138,988   $  63,742,641   $  57,719,796    $  57,224,981   $  37,819,018

             FINANCIAL USES:
               Salaries and Wages         66,455,842  72,711,630  70,243,105   74,296,218   1,180,192   1,056,076  914,135   1,080,883
               Employee Benefits          19,359,699  20,779,949  21,889,484   22,334,110   135,592   201,368  156,952   203,602
               Supplies                    2,229,526  2,212,051  2,074,942   2,235,051   36,961   47,368  53,364   47,368
               Other Services and Charges  17,641,858  17,442,302  17,523,871   18,887,971   16,476,651   16,388,932  17,182,476   20,370,759
               Maintenance                 9,519,827  10,581,825  10,623,681   11,058,958   32,085   42,453  62,288   40,960
               Capital Outlay               685,154  2,552,404  1,742,139   2,697,718   4,856,692   27,311,822  8,278,529   27,405,188
               Debt Service                 508,174  263,174  263,174   263,174   4,875    4,875     4,875   4,875
                 Total Expenditures/Expenses    116,400,081    126,543,335  124,360,396   131,773,200   22,723,045   45,052,894  26,652,619   49,153,635

             Extraordinary Expense/Loan Payback  -       -        -         -        -        -        -        -
               Transfers to other funds   37,436,500  29,026,366  29,060,370   7,807,084   28,634,925   23,367,662  22,129,977   7,700,414
                 Total Financial Uses   $  153,836,581    $  155,569,701    $  153,420,762   $  139,580,285   $  51,357,970   $  68,420,556    $  48,782,596   $  56,854,049
             Revenue over/under Expenditures  (2,632,418)   (2,378,934)   747,641   5,558,704   12,384,671   (10,700,760)   8,442,385   (19,035,031)

             FUND BALANCES/WORKING CAPITAL
               Unassigned Fund Balances/Unrestricted  -  -        -         -        -        -        -        -
             Working Capital Beginning of Year  75,232,267  63,927,013  72,233,751   72,981,391   17,358,036   29,515,836  29,742,707   38,185,092

             Other Items Affecting Working Capital  (366,096)   -  -        -        -        -        -        -
             Unassigned Fund Balances/Unrestricted
               Working Capital  End of Year  $  72,233,751   $  61,548,079   $  72,981,391  $  78,540,095  $  29,742,707   $  18,815,076    $  38,185,092   $  19,150,059
                                                                             1� Special Revenue Funds:
                                                                             Hotel Occupancy Tax Fund
                                                                             Venue Tax Fund
                                                                             Development Corporation Fund
                                                                             EB-5 Fund
                                                                             Parkland 1,2 & 3 Funds
                                                                             Public, Educational, & Governmental (PEG) Fund
                                                                             Friends of Quinta
                                                                             Community Development Block Grant
                                                                             Police Department Seized Fund
                                                                             Downtown Services Parking Fund
                                                                             Drainage Fee Fund
                                                                             Christmas Parade Fund
                                                                             TIRZ #1 & 2A
                                                                             American Rescue Plan Fund
                                                                             McAllen Marketing
                                                                             City Special Events


                                                            - 80 -                                        Table of Contents