
Page 23 - ANALYSIS.XLS
P. 23
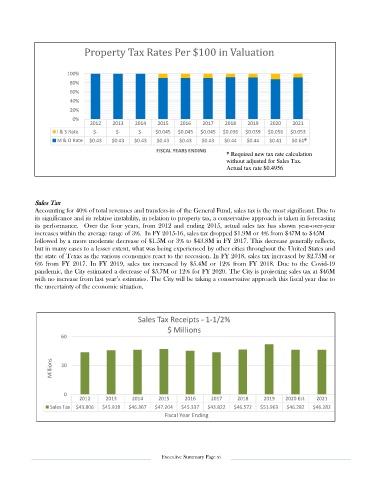
Property Tax Rates Per $100 in Valuation


                       100%
                        80%
                        60%
                        40%
                        20%
                         0%
                               2012   2013    2014   2015    2016   2017   2018    2019   2020    2021
                    I & S Rate  $-     $-      $-   $0.045  $0.045  $0.045  $0.036  $0.039  $0.056  $0.053
                                                                                                      *
                    M & O Rate  $0.43  $0.43  $0.43  $0.43  $0.43   $0.43  $0.44   $0.44  $0.41   $0.61*
                                                     FISCAL YEARS ENDING
                                                                            * Required new tax rate calculation
                                                                            without adjusted for Sales Tax.
                                                                            Actual tax rate $0.4956


             Sales Tax
             Accounting for 40% of total revenues and transfers-in of the General Fund, sales tax is the most significant. Due to
             its significance and its relative instability, in relation to property tax, a conservative approach is taken in forecasting
             its  performance.    Over  the  four  years,  from  2012  and  ending  2015,  actual sales  tax  has  shown  year-over-year
             increases within the average range of 3%.  In FY 2015-16, sales tax dropped $1.9M or 4% from $47M to $45M
             followed by a more moderate decrease of $1.5M or 3% to $43.8M in FY 2017. This decrease generally reflects,
             but in many cases to a lesser extent, what was being experienced by other cities throughout the United States and
             the state of Texas as the various economies react to the recession. In FY 2018, sales tax increased by $2.75M or
             6%  from  FY  2017.  In  FY  2019,  sales  tax  increased  by  $5.4M  or  12%  from  FY  2018.  Due  to  the  Covid-19
             pandemic, the City estimated a decrease of $5.7M or 12% for FY 2020. The City is projecting sales tax at $46M
             with no increase from last year’s estimates. The City will be taking a conservative approach this fiscal year due to
             the uncertainty of the economic situation.


                                               Sales Tax Receipts - 1-1/2%
                                                        $ Millions
                     60


                  Millions  30


                      0
                           2012     2013     2014    2015     2016     2017     2018    2019   2020 Est.  2021
                  Sales Tax  $43.806  $45.918  $46.367  $47.204  $45.337  $43.822  $46.572  $51.963  $46.282  $46.282
                                                        Fiscal Year Ending


                                                      Executive Summary Page xi