Page 400 - ANALYSIS.XLS
P. 400

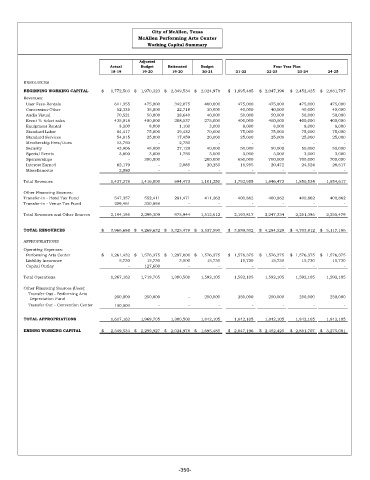
City of McAllen, Texas
                                            McAllen Performing Arts Center
                                               Working Capital Summary


                                             Adjusted
                                   Actual    Budget   Estimated  Budget                  Four Year Plan
                                   18-19      19-20     19-20     20-21      21-22     22-23     23-24     24-25
      RESOURCES
      BEGINNING WORKING CAPITAL  $       1,772,503  $     1,970,323  $     2,349,534  $     2,024,978  $     1,695,485  $    2,047,196  $    2,452,425  $     2,861,707
      Revenues:
        User Fees-Rentals                   611,355            475,000            342,075            400,000            475,000           475,000           475,000            475,000
        Concession-Other               52,335              35,000              22,718              30,000             40,000              40,000             40,000              40,000
        Audio Visual                   70,521              50,000              28,640              40,000             50,000              50,000             50,000              50,000
        Event % ticket sales                435,018            400,000            208,537            275,000            400,000           400,000           400,000            400,000

        Equipment Rental                3,200     8,000     1,100     3,000    8,000     8,000       8,000   8,000
        Standard Labor               84,417              75,000              39,432              70,000              75,000             75,000             75,000             75,000

        Standard Services              54,815              25,000              17,459              20,000              25,000             25,000             25,000             25,000
        Membership Fees/Dues           13,750      -        2,750      -          -         -         -         -
        Security                       43,906              45,000    27,129              40,000             50,000              50,000             50,000             50,000

        Special Events                  3,800     3,000     1,750   3,000      3,000       3,000     3,000   3,000

        Sponsorships                     -      300,000      -    200,000            650,000           700,000           700,000            700,000


        Interest Earned              62,179        -        2,885  20,250             16,955              20,472             24,524             28,617
        Miscellaneous                 2,080        -         -         -          -         -         -         -

      Total Revenues                     1,437,378         1,416,000           694,473          1,101,250         1,792,955        1,846,472        1,850,524         1,854,617
      Other Financing Sources:
      Transfer-in - Hotel Tax Fund              547,357            552,411           281,471             411,362            400,862           400,862           400,862            400,862
      Transfer-in - Venue Tax Fund              209,461            330,898  -   -    -      -         -         -
      Total Revenues and Other Sources          2,194,195         2,299,309            975,944         1,512,612         2,193,817        2,247,334        2,251,386         2,255,479
      TOTAL RESOURCES           $       3,966,698  $     4,269,632  $     3,325,478  $     3,537,590  $     3,889,302  $    4,294,529  $    4,703,812  $     5,117,186

      APPROPRIATIONS
      Operating Expenses:
        Performing Arts Center  $       1,261,432  $     1,576,375  $     1,297,000  $     1,576,375  $     1,576,375  $    1,576,375  $    1,576,375  $     1,576,375
        Liability Insurance           5,730              15,730    3,500              15,730             15,730              15,730             15,730             15,730

        Capital Outlay                   -      127,600      -         -          -         -         -         -
      Total Operations                   1,267,162         1,719,705        1,300,500         1,592,105         1,592,105        1,592,105        1,592,105         1,592,105
      Other Financing Sources (Uses):
         Transfer Out - Performing Arts
          Depreciation Fund                 250,000            250,000  -      250,000            250,000           250,000           250,000            250,000
        Transfer Out - Convention Center              100,000  -    -   -         -         -         -         -

      TOTAL APPROPRIATIONS               1,617,162         1,969,705         1,300,500         1,842,105         1,842,105        1,842,105        1,842,105         1,842,105
      ENDING WORKING CAPITAL    $       2,349,534  $     2,299,927  $     2,024,978  $     1,695,485  $     2,047,196  $    2,452,425  $    2,861,707  $     3,275,081


                                                          -350-
   395   396   397   398   399   400   401   402   403   404   405