Page 402 - ANALYSIS.XLS
P. 402

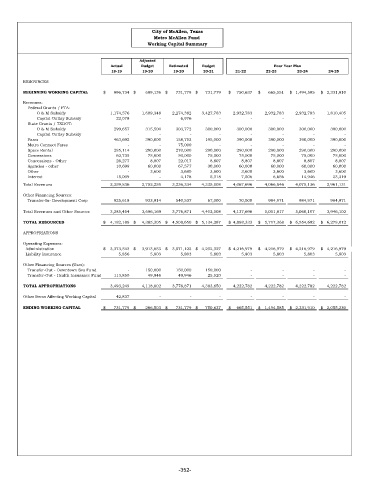
City of McAllen, Texas
                                                  Metro McAllen Fund
                                                Working Capital Summary

                                             Adjusted
                                   Actual    Budget    Estimated  Budget                 Four Year Plan
                                   18-19      19-20     19-20     20-21      21-22     22-23     23-24     24-25
      RESOURCES
      BEGINNING WORKING CAPITAL  $        896,734  $         699,136  $        731,779  $       731,779   $      750,637  $        665,551  $    1,494,585  $    2,331,910
      Revenues:
        Federal Grants / FTA:
           O & M Subsidy                1,174,576          1,609,348         2,274,382        3,427,783        2,932,783         2,932,783        2,932,783        1,810,405
           Capital Outlay Subsidy              22,078  -     6,976     -          -         -         -          -
        State Grants / TXDOT:
           O & M Subsidy                   299,657             315,500    303,772           300,000          300,000            300,000           300,000           300,000
           Capital Outlay Subsidy        -         -         -         -          -         -         -          -
        Fares                              463,692             390,000    158,752           195,000          390,000            390,000           390,000           390,000
        Metro Connect Fares              -         -       75,000      -          -         -         -          -
        Space Rental                       285,114             290,000    270,000           290,000          290,000            290,000           290,000           290,000
        Concessions                          62,735    75,000    50,000             75,000            75,000              75,000             75,000             75,000
        Concessions - Other                  26,277    8,807    22,017    8,807              8,807    8,807    8,807    8,807
        Agencies - other                     10,699    60,000    67,577             30,000            60,000              60,000             60,000             60,000
        Other                            -        3,600     3,680     3,600              3,600    3,600    3,600    3,600
        Interest                             15,009  -      4,178     5,318              7,506    6,656             14,946             23,319
      Total Revenues                   2,359,836          2,752,255         3,236,334         4,335,508       4,067,696         4,066,846        4,075,136         2,961,131
      Other Financing Sources:
        Transfer-In- Development Corp           925,618             933,914            540,537             67,000            70,000             984,971           984,971           984,971

      Total Revenues and Other Sources         3,285,454          3,686,169         3,776,871        4,402,508        4,137,696         5,051,817        5,060,107        3,946,102
      TOTAL RESOURCES            $     4,182,188  $      4,385,305  $     4,508,650  $    5,134,287   $   4,888,333  $     5,717,368  $    6,554,692  $    6,278,012
      APPROPRIATIONS
      Operating Expenses:
        Administration           $     3,373,543  $      3,913,053  $     3,571,122  $    4,202,327   $   4,216,979  $     4,216,979  $    4,216,979  $    4,216,979
        Liability Insurance             5,856                 5,803                5,803               5,803              5,803    5,803    5,803    5,803

      Other Financing Sources (Uses):
        Transfer-Out - Downtown Svs Fund   -     150,000            150,000           150,000  -   -    -        -
        Transfer-Out - Health Insurance Fund           113,850    49,946              49,946             25,520  -   -    -   -
      TOTAL APPROPRIATIONS              3,493,249          4,118,802         3,776,871        4,383,650        4,222,782         4,222,782        4,222,782        4,222,782
      Other Items Affecting Working Capital              42,837  -   -   -        -         -         -          -
      ENDING WORKING CAPITAL     $        731,779  $         266,503  $        731,779  $       750,637   $      665,551  $     1,494,585  $    2,331,910  $    2,055,230


                                                          -352-
   397   398   399   400   401   402   403   404   405   406   407