
Page 143 - Budget FY 2022-2023 - Update
P. 143
Adopted Budget 2023 City of McAllen, Texas
General Fund
Fire
https://www.mcallen.net/departments/fire
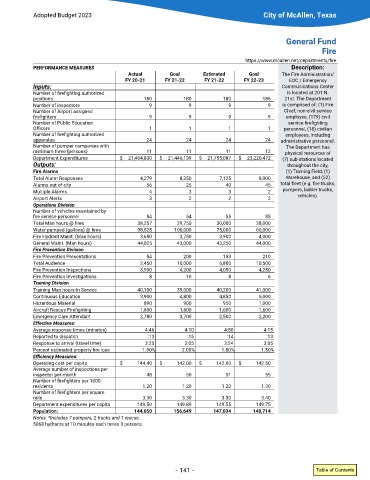
PERFORMANCE MEASURES Description:
Actual Goal Estimated Goal The Fire Administration/
FY 20-21 FY 21-22 FY 21-22 FY 22-23 EOC / Emergency
Inputs: Communications Center
Number of firefighting authorized is located at 201 N�
positions 180 180 180 186 21st� The Department
Number of inspectors 9 9 9 9 is comprised of: (1) Fire
Number of Airport assigned Chief, non-civil service
firefighters 9 9 9 9 employee, (179) civil
Number of Public Education service firefighting
Officers 1 1 1 1 personnel, (18) civilian
Number of firefighting authorized employees, including
apparatus 24 24 24 24 administrative personnel�
Number of pumper companies with The Department has
minimum three (persons) 11 11 11 12 physical resources of
Department Expenditures $ 21,404,830 $ 21,446,139 $ 21,755,087 $ 23,220,472 (7) sub-stations located
Outputs: throughout the city,
Fire Alarms (1) Training Field, (1)
Total Alarm Responses 4,279 8,250 7,125 8,000 Warehouse, and (52)
Alarms out of city 56 25 40 45 total fleet (e.g. fire trucks,
Multiple Alarms 4 3 3 2 pumpers, ladder trucks,
Airport Alerts 3 2 2 2 vehicles)�
Operations Division
Number of vehicles maintained by
fire service personnel 54 54 55 55
Total Man hours @ fires 38,257 29,750 30,000 28,000
Water pumped (gallons) @ fires 98,525 100,000 75,000 60,000
Fire Hydrant Maint� (Man hours) 3,650 3,750 3,900 4,000
General Maint� (Man hours) 44,025 43,000 43,250 44,000
Fire Prevention Division
Fire Prevention Presentations 54 200 153 210
Total Audience 2,450 10,000 6,800 10,500
Fire Prevention Inspections 3,900 4,200 4,050 4,250
Fire Prevention Investigations 8 10 8 6
Training Division
Training Man hours-In Service 40,100 39,000 40,200 41,000
Continuous Education 3,900 4,800 4,850 5,000
Hazardous Material 890 900 950 1,000
Aircraft Rescue Firefighting 1,600 1,600 1,600 1,600
Emergency Care Attendant 2,780 3,700 2,500 2,200
Effective Measures:
Average response times (minutes) 4:46 4:10 4:50 4:15
Reported to dispatch :13 :15 :14 :13
Response to arrival (travel time) 3:25 3:05 3:24 3:05
Percent estimated property fire loss 1�90% 2�00% 1�80% 1�50%
Efficiency Measures:
Operating cost per capita $ 144�40 $ 142�00 $ 142�00 $ 142�50
Average number of inspections per
inspector per month 48 50 51 55
Number of firefighters per 1000
residents 1�20 1�20 1�20 1�30
Number of firefighters per square
mile 3�30 3�30 3�30 3�40
Department expenditures per capita 149�50 149�89 149�55 149�75
Population: 144,650 156,649 147,034 148,714
Notes: *Includes 7 pumpers, 2 trucks and 1 rescue.
5068 hydrants at 10 minutes each times 3 persons�
- 141 - Table of Contents